Southern Australia's Record Dry Spell – While the North Floods: A Tale of Two Extremes
Over the past year, Australia has experienced a striking climatic divide: prolonged, severe drought across the southern states, and intense summer rainfall and flooding across inland northern Australia. This post unpacks the climate drivers behind this contrast and explains why regions like Tasmania, southern WA, and Victoria dried out, while inland Queensland flooded and Lake Eyre began to fill once again.
📉 Southern Australia's Rainfall Deficits – Visualised
The maps below, provided by the Bureau of Meteorology, show the rainfall decile rankings for two periods:
🗓️ 12 Months: May 2024 – April 2025
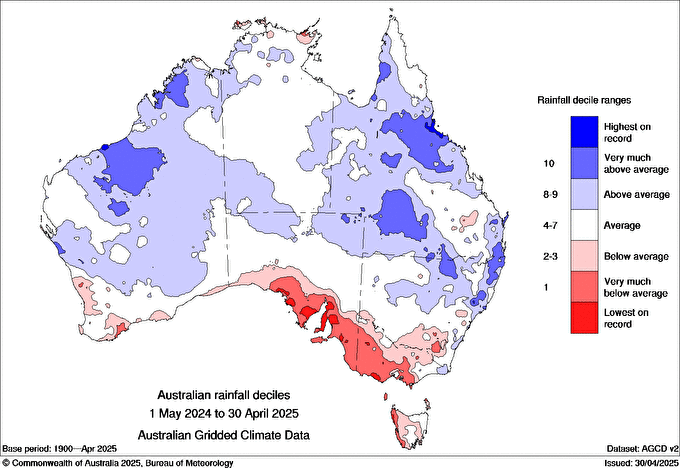
Deep red shading marks regions with the lowest on record rainfall over the past year, including key agricultural areas across southern WA, southern SA, southwest VIC, and Tasmania.
🗓️ 24 Months: May 2023 – April 2025
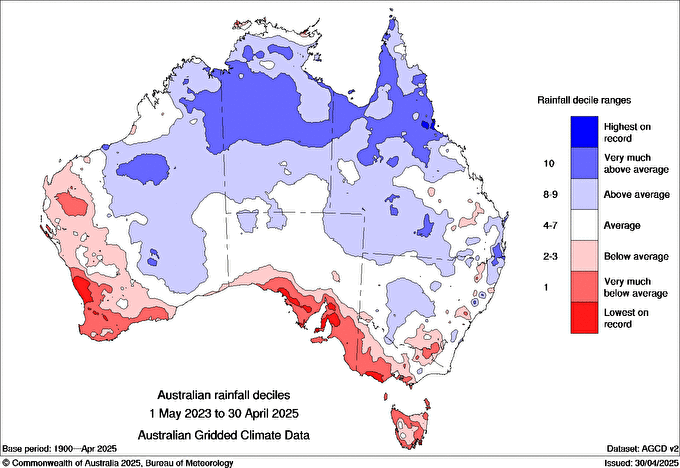
Deep red shading marks regions with the lowest on record rainfall over the past year, including key agricultural areas across southern WA, southern SA, southwest VIC, and Tasmania.
🗓️ Year-to-Date: January – April 2025
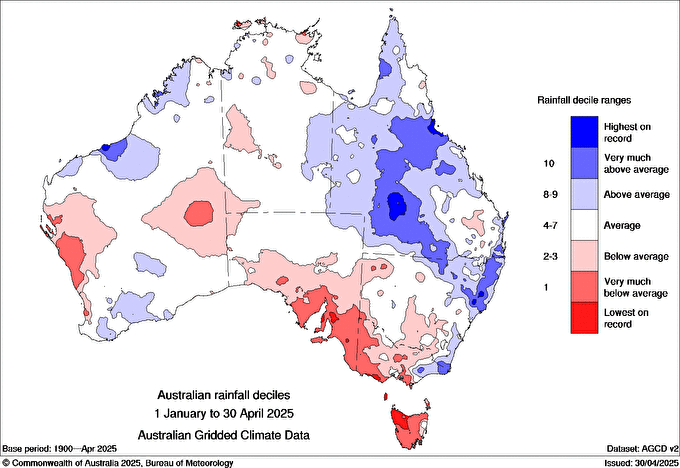
Despite being in the wettest part of the year in northern Australia, many southern regions continued to record very much below average to lowest on record rainfall. Meanwhile, inland Queensland and parts of the NT stood out with widespread rainfall surpluses.
What’s Driving the Dry in the South?
- Subtropical Ridge: Stronger and shifted southward, blocking rain-bearing systems.
- Positive Indian Ocean Dipole: Suppressed Indian Ocean moisture from mid-2023.
- El Niño: Established spring 2023, reducing rainfall across the continent’s south and east.
- Positive Southern Annular Mode (SAM): Storm tracks diverted south of mainland Australia.
Wet Season 2024–25: Torrential Rains Across the North
In stark contrast to the southern drought, the 2024–25 summer wet season delivered substantial rainfall across inland Queensland, the NT, and parts of WA. Key drivers included:
- Multiple monsoon bursts and an active Madden-Julian Oscillation.
- One or more ex-tropical cyclones bringing rainfall deep inland.
This led to major inland flood events, with rivers like the Thomson, Barcoo, and Georgina feeding vast volumes of water into the Lake Eyre Basin. A partial to major fill of Lake Eyre is expected by mid-2025.
🌏 Climate in Contrast
The 2024–25 period is a textbook example of Australia’s extreme climate variability. While tropical systems drenched the north, high pressure dominance and displaced storm tracks left the south parched. Climate change may be intensifying these trends through:
- More frequent positive SAM phases in summer.
- Poleward shift of the mid-latitude westerlies.
- Greater occurrence of positive IOD + El Niño combinations.
🧭 What’s Driving the Divide? A Tale of Two Climate Systems
The rainfall extremes observed across Australia between mid-2024 and early 2025 — record dry in the south and record wet in the north — are the product of contrasting regional climate mechanisms. Here we explore these in detail.
🌵 Drivers of Southern Australia's Prolonged Dry
- Persistent Subtropical Ridge Anomalies: The subtropical ridge (STR) has been anomalously strong and positioned further south than usual. This blocked or weakened westerly cold fronts and moist onshore flows, particularly through winter and spring 2024. The result was clear skies, higher pressure, and widespread drying across southern WA, SA, VIC, and Tasmania.
- Indian Ocean Dipole (IOD) – Positive Phase: A strong positive IOD emerged in mid-2023 and persisted into late spring. This pattern cooled waters near Indonesia and northwest Australia while warming the western Indian Ocean, reducing cloud formation and monsoonal inflow over southern Australia. Tasmania and southern WA were particularly sensitive to this suppression.
- El Niño Conditions in the Pacific: By late winter 2023, a moderate El Niño developed. El Niño typically leads to higher surface pressures, fewer cold fronts, and reduced rainfall over southern and eastern Australia. Combined with the positive IOD, this created a powerful drying double-act through spring and early summer.
- Lack of Southern Ocean Influence: Cold fronts and mid-latitude storm systems from the Southern Ocean were frequently diverted south or dissipated by zonal winds and blocking highs. Reanalysis data shows significantly reduced frontal activity over Tasmania and southern Australia in the past 12 months.
- Indian Ocean SST Gradient and Warm Blob Effects: Anomalously cool SSTs in the southeast Indian Ocean and Southern Ocean reduced evaporation, while a “warm blob” in the central Indian Ocean failed to deliver moisture to Australia. The usual pre-frontal northwesterly airflows were absent or moisture-starved.
- Climate Change and Structural Drying: Southern Australia, particularly southwest WA, has experienced a 20–30% decline in cool-season rainfall over the last 50 years. Poleward-shifting storm tracks, more frequent high-pressure systems, and reduced frontal penetration are consistent with climate change projections.
🌴 Drivers of Northern and Inland Australia's Exceptional Wet
- Active Monsoon Season: Despite a late onset, the 2024–25 monsoon was persistent and intense from January to March. Repeated bursts brought deep tropical moisture into the continent, feeding rainfall into western Queensland and the Lake Eyre Basin.
- Enhanced Madden–Julian Oscillation (MJO) Activity: Several MJO pulses passed through the Australian longitudes during summer, intensifying convection and sustaining widespread storm activity. This intra-seasonal tropical driver helped override El Niño’s drying influence in the north.
- Ex-Tropical Cyclones and Inland Tracks: One or more ex-tropical cyclones moved inland through northwest QLD and the NT, bringing long-duration rain events. These systems connected with surface troughs, forming rain bands that fed central rivers for weeks.
- Land–Atmosphere Feedbacks: Early season rainfall increased soil moisture, creating positive feedback loops. Higher surface evaporation and latent heat release allowed storms to redevelop daily across Queensland’s interior well into March.
- Warm Tropical SSTs (Timor & Arafura Seas): By early 2025, SSTs around northern Australia had warmed, boosting moisture availability and fuelling convection over the northern and inland basins.
- El Niño’s Limited Influence in the Tropics: While El Niño suppressed rainfall in the south, its effects were more variable in the north. Tropical Australia remained responsive to short-term systems like MJO and cyclones, allowing for localised and repeated rain events despite the broader Pacific signal.
- Climate Change and Rainfall Extremes: As the atmosphere warms, it holds more water vapour. This increases the potential intensity of rainfall during active phases, particularly in the tropics. Long-term changes may also be increasing the frequency of heavy inland rain events and moisture recycling.
🔍 Summary Comparison
| Climate Driver | Southern Australia (Dry) | Northern/Inland Australia (Wet) |
|---|---|---|
| Subtropical Ridge | Strong, persistent, blocking | Weakened influence |
| Indian Ocean Dipole | Positive phase – drying | Influence faded by summer |
| El Niño | Suppressed rainfall, stable highs | Limited impact; overridden by MJO |
| Southern Ocean Storms | Diverted or absent | Not influential |
| Monsoon / Cyclones | Suppressed | Frequent, sustained inland tracks |
| Madden–Julian Oscillation | Weak / unhelpful phases | Repeated active phases boosted convection |
| Sea Surface Temperatures | Cooler in south, weak evaporation | Warm in north, strong moisture feed |
| Climate Change Signal | Cool-season drying trend | Amplified rainfall extremes |